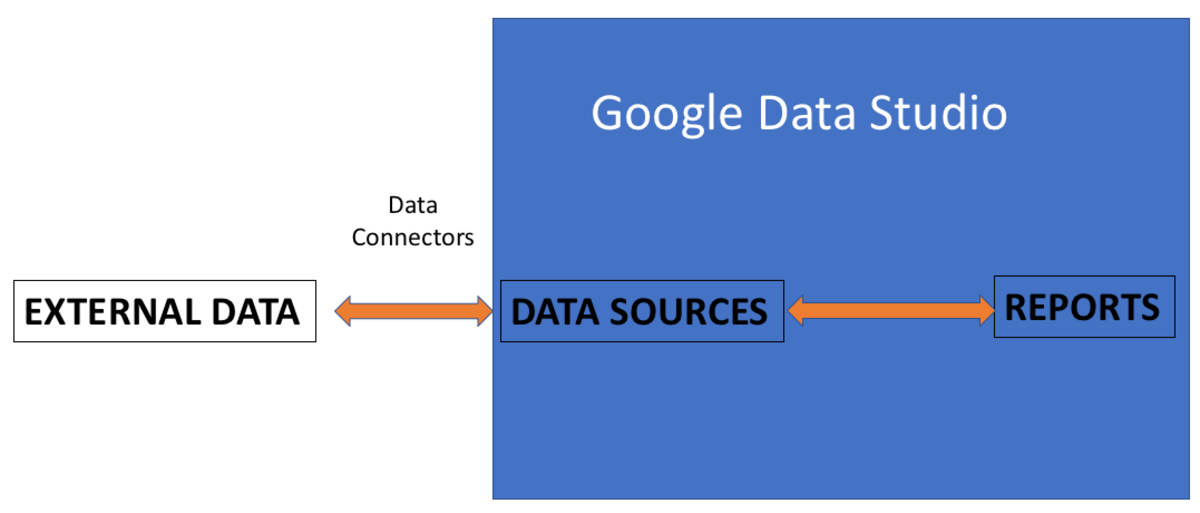
The Data Connectors provided by Google Data Studio will directly access your data and refresh it.
About Data Connectors
Data sources act as pipes to connect a Data Studio report to a collection of underlying data. Each source has a unique, pre-built Data Connector to ensure your data is easy to access and use.
Google Account
Data Studio Lets You Visualise Data From Many Sources
The power of Google Data Studio stems from the different varied sources from which it can pull data. With Data Connectors, you can pull from almost any data available. These include Google Analytics, AdWords, Search Console, BigQuery, and more. Access to external data is based on the account with which you sign into Data Studio. This means that Data Studio gives you access to those data under that same account. There is a fix to connect Data Studio to different accounts. This will be discussed in the later part of this tutorial.
Google Sheets Gives You The Data Without Managing Complex Databases
This tutorial assumes you are familiar with Google Sheets. You will learn to use Data Studio to create a Visualisation Report that connects to one of your own Google Sheets. Many businesses already use Google Sheets for reporting purposes. You can connect Google Sheets to Data Studio. Data Studio knows how to interpret the data from the Data Connector you create.
What Else Can You Achieve Using Google Data Studio?
Calculated Metrics: You can also do calculated metrics and dimensions. For example, the original datasets have two columns, Population and Country Size. You can easily create a formula in Google Data Studio to calculate population density by dividing the Population by Country Size. Blended Data Source: In Google Data Studio, you can join the records in one Data Source to the records of up to four other Data Sources. To join the data, simply identify a commonly shared dimension amongst the different Data Sources. This is known as a Join Key. Interaction Filters: Google Data Studio is also highly interactive. Add Chart Interaction filters to apply controls to specific charts. Or when interactions are enabled on a chart, you can turn that cart into filter controls by clicking one or more dimension values in the chart. Templates Gallery: Still unsure how to start? View what others have built in the Gallery section. Simply make a copy of the template and connect your own data. Multipage Reports: Google Data Studio is fully customisable. Create one page or a multi-page report. Add or remove pages just like PowerPoint. Report-Level and Page-Level: For reports with multiple pages, any element in the report can be set to be Report-level or Page-level. Report-level elements are usually for headers and footers which you want to be duplicated on every page of the Report. You can also make use of Report-level feature to duplicate important information that you want to be shown on each page.
Create an Account and Login
I shall assume that you have a Google account ready. To begin, visit datastudio.google.com and sign in with your Google account. This is how Google Data Studio looks like when you first login.
Use It For Free
Google Data Studio Portal
Are You Ready For More?
The possible uses of Google Data Studio seems endless. I can’t wait to share with you how to start creating your first Visualisation Chart in the next article. https://datastudio.google.com/overview
Navigation
Learn How to Use Google Data Studio to Visualise Data Easily Google Data Studio - Getting Started Data Connectors - Connect To Google Sheets Your First Visualisation Report using Google Data Studio Richer Interactive in Google Data Studio About Filter Control In Google Data Studio Using Charts as Interactive Filters in Google Data Studio Managing Data Sources in Google Data Studio This content is accurate and true to the best of the author’s knowledge and is not meant to substitute for formal and individualized advice from a qualified professional. © 2020 Heng Kiong Yap
Comments
Umesh Chandra Bhatt from Kharghar, Navi Mumbai, India on March 28, 2020: This is a great article. Might be useful for data engineers or data scientists.


